Audara Reports
The reports menu, and the toolbar all nine groups share
Reports Menu
The Reports Menu is the way into all of Audara's analytics. It is not a report itself: it is the map of the ones you have, grouped by the channel or the module the data comes from.
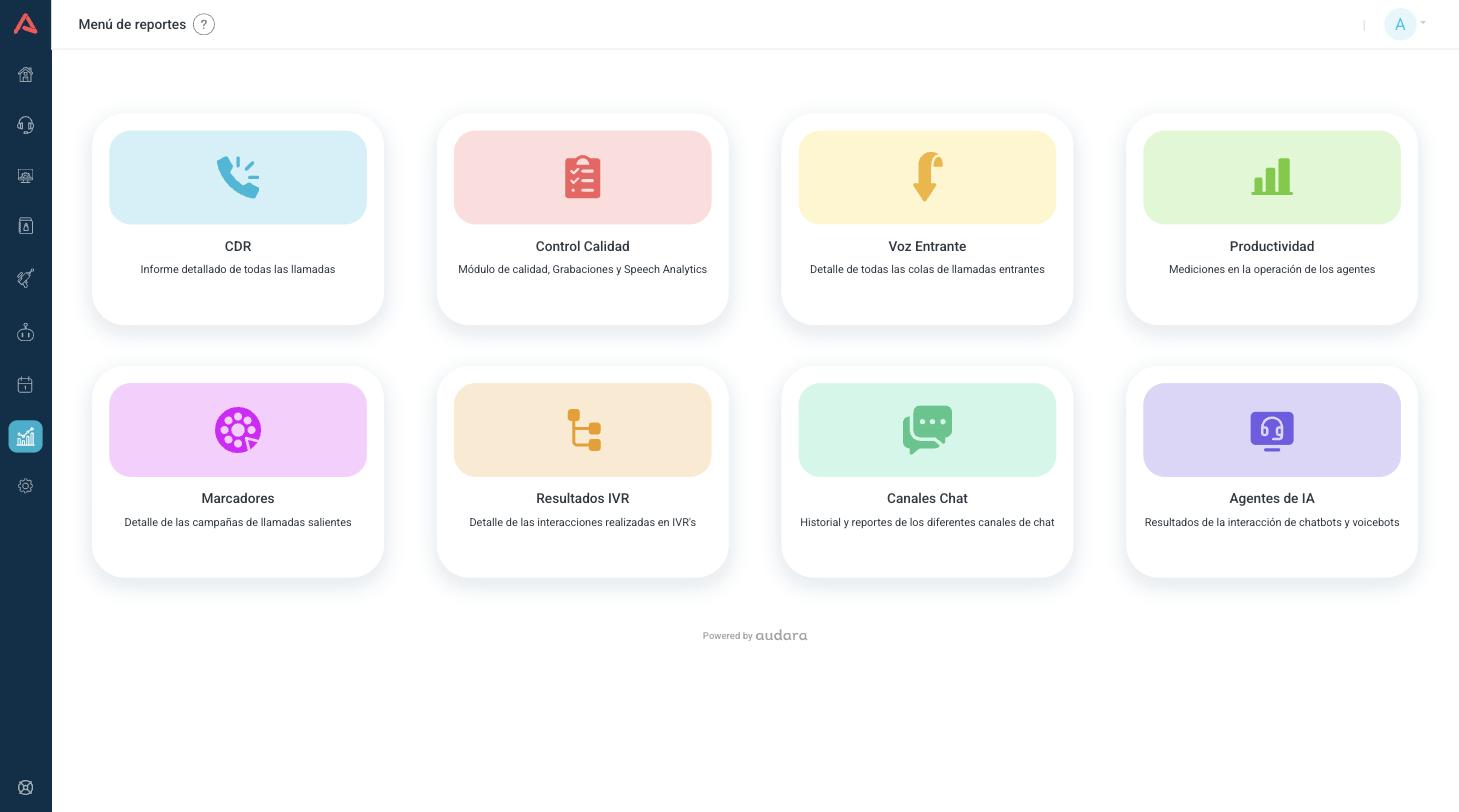
There are nine groups:
- CDR
- The detailed record of every call, one by one. Continues in CDR.
- Quality Control
- Recordings, agent evaluation and Speech Analytics.
- Inbound Voice
- Everything that happens in your inbound campaigns: abandonments, service level, typification. Continues in Inbound voice reports.
- Productivity
- How your agents worked: login, pauses, times.
- Dialers
- How each outbound campaign did. Continues in Dialer reports.
- IVR Results
- Which options customers pressed in each voice menu. Continues in IVR results.
- Chat Channels
- History and reports for WhatsApp, webchat and your other conversation channels.
- AI Agents
- How your chatbots and voicebots behaved. Continues in AI Agent reports.
- Tickets
- Ticket results and SLAs, along with their integrations.
Each group holds several reports. Under Dialers, for instance, you get the general preview and automatic report, callback, the management summary, predictive and typification.
Who sees what
A card shows up in the menu only if you are allowed to open at least one report in that group. If a whole group is out of your reach, its card is not drawn, which is why two people can open this same screen and count a different number of cards.
Permissions are not set here but on each user's record. And they come in two layers: first which reports someone can open, and then which data they can see inside each one. Someone can have access to the campaign activity report and still see only the campaigns in their own group.
Reports are built on historical data, so they are not real time. An event can take a few minutes to show up. If what you need is the state of the operation right now, the place for that is the supervisor panel, not the reports.
The toolbar every report shares
Audara's reports share the same toolbar. It is worth learning once, because it then works the same across all nine groups.
Not all of them carry the same buttons: the filter and the download are always there, and the view selector only shows up where the report has more than one view. The IVR Results ones, for instance, come in list form only.
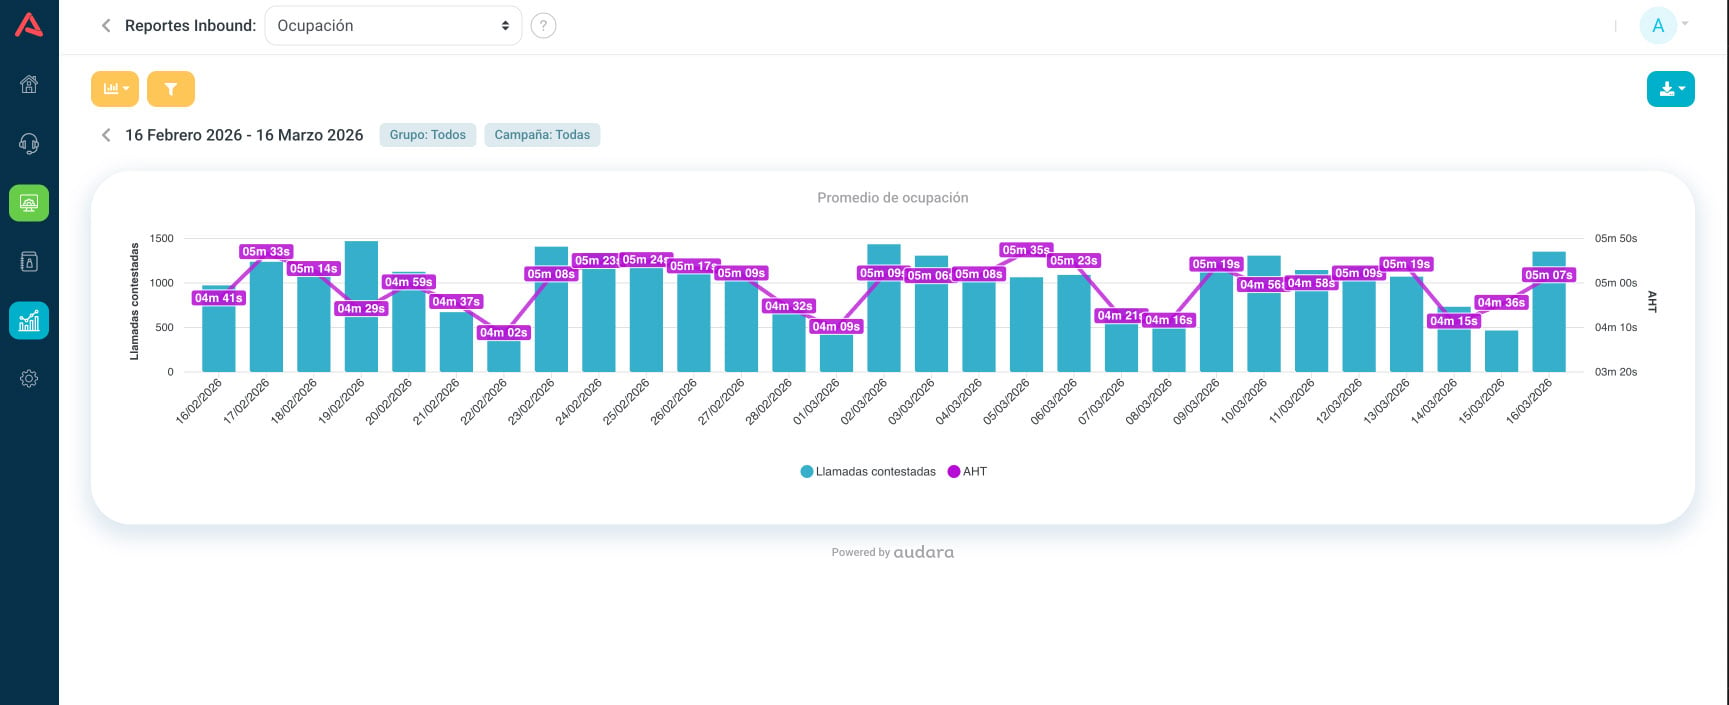
Below the toolbar you will see the period you asked for and a row of grey badges with the active filters: the group, the campaign, the client. They tell you at a glance what you are looking at, and some of them open to show the full list of what they include.
List and graph
The first yellow button, at the top left, changes how the data is drawn.
Opening it lets you pick between List, which lays the data out in a table row by row, and Graph, which sums it up visually. Some reports add a third view with another cut of the same information; campaign activity, for example, adds a Campaign Graph.
The graph view brings its own controls depending on the report: sort from highest to lowest, switch the chart type, or turn a series off to stop seeing it. And both views answer to the filters: change the date range and the graph redraws itself.
The list and the graph do not always carry the same columns. The graph is meant for the trend, and some list controls, like hiding columns or swapping zeros for dashes, only appear in the list.
The filters
The second yellow button, the one with the funnel icon, opens the filter panel.

It is called Search Filters and it slides in from the right edge of the screen.
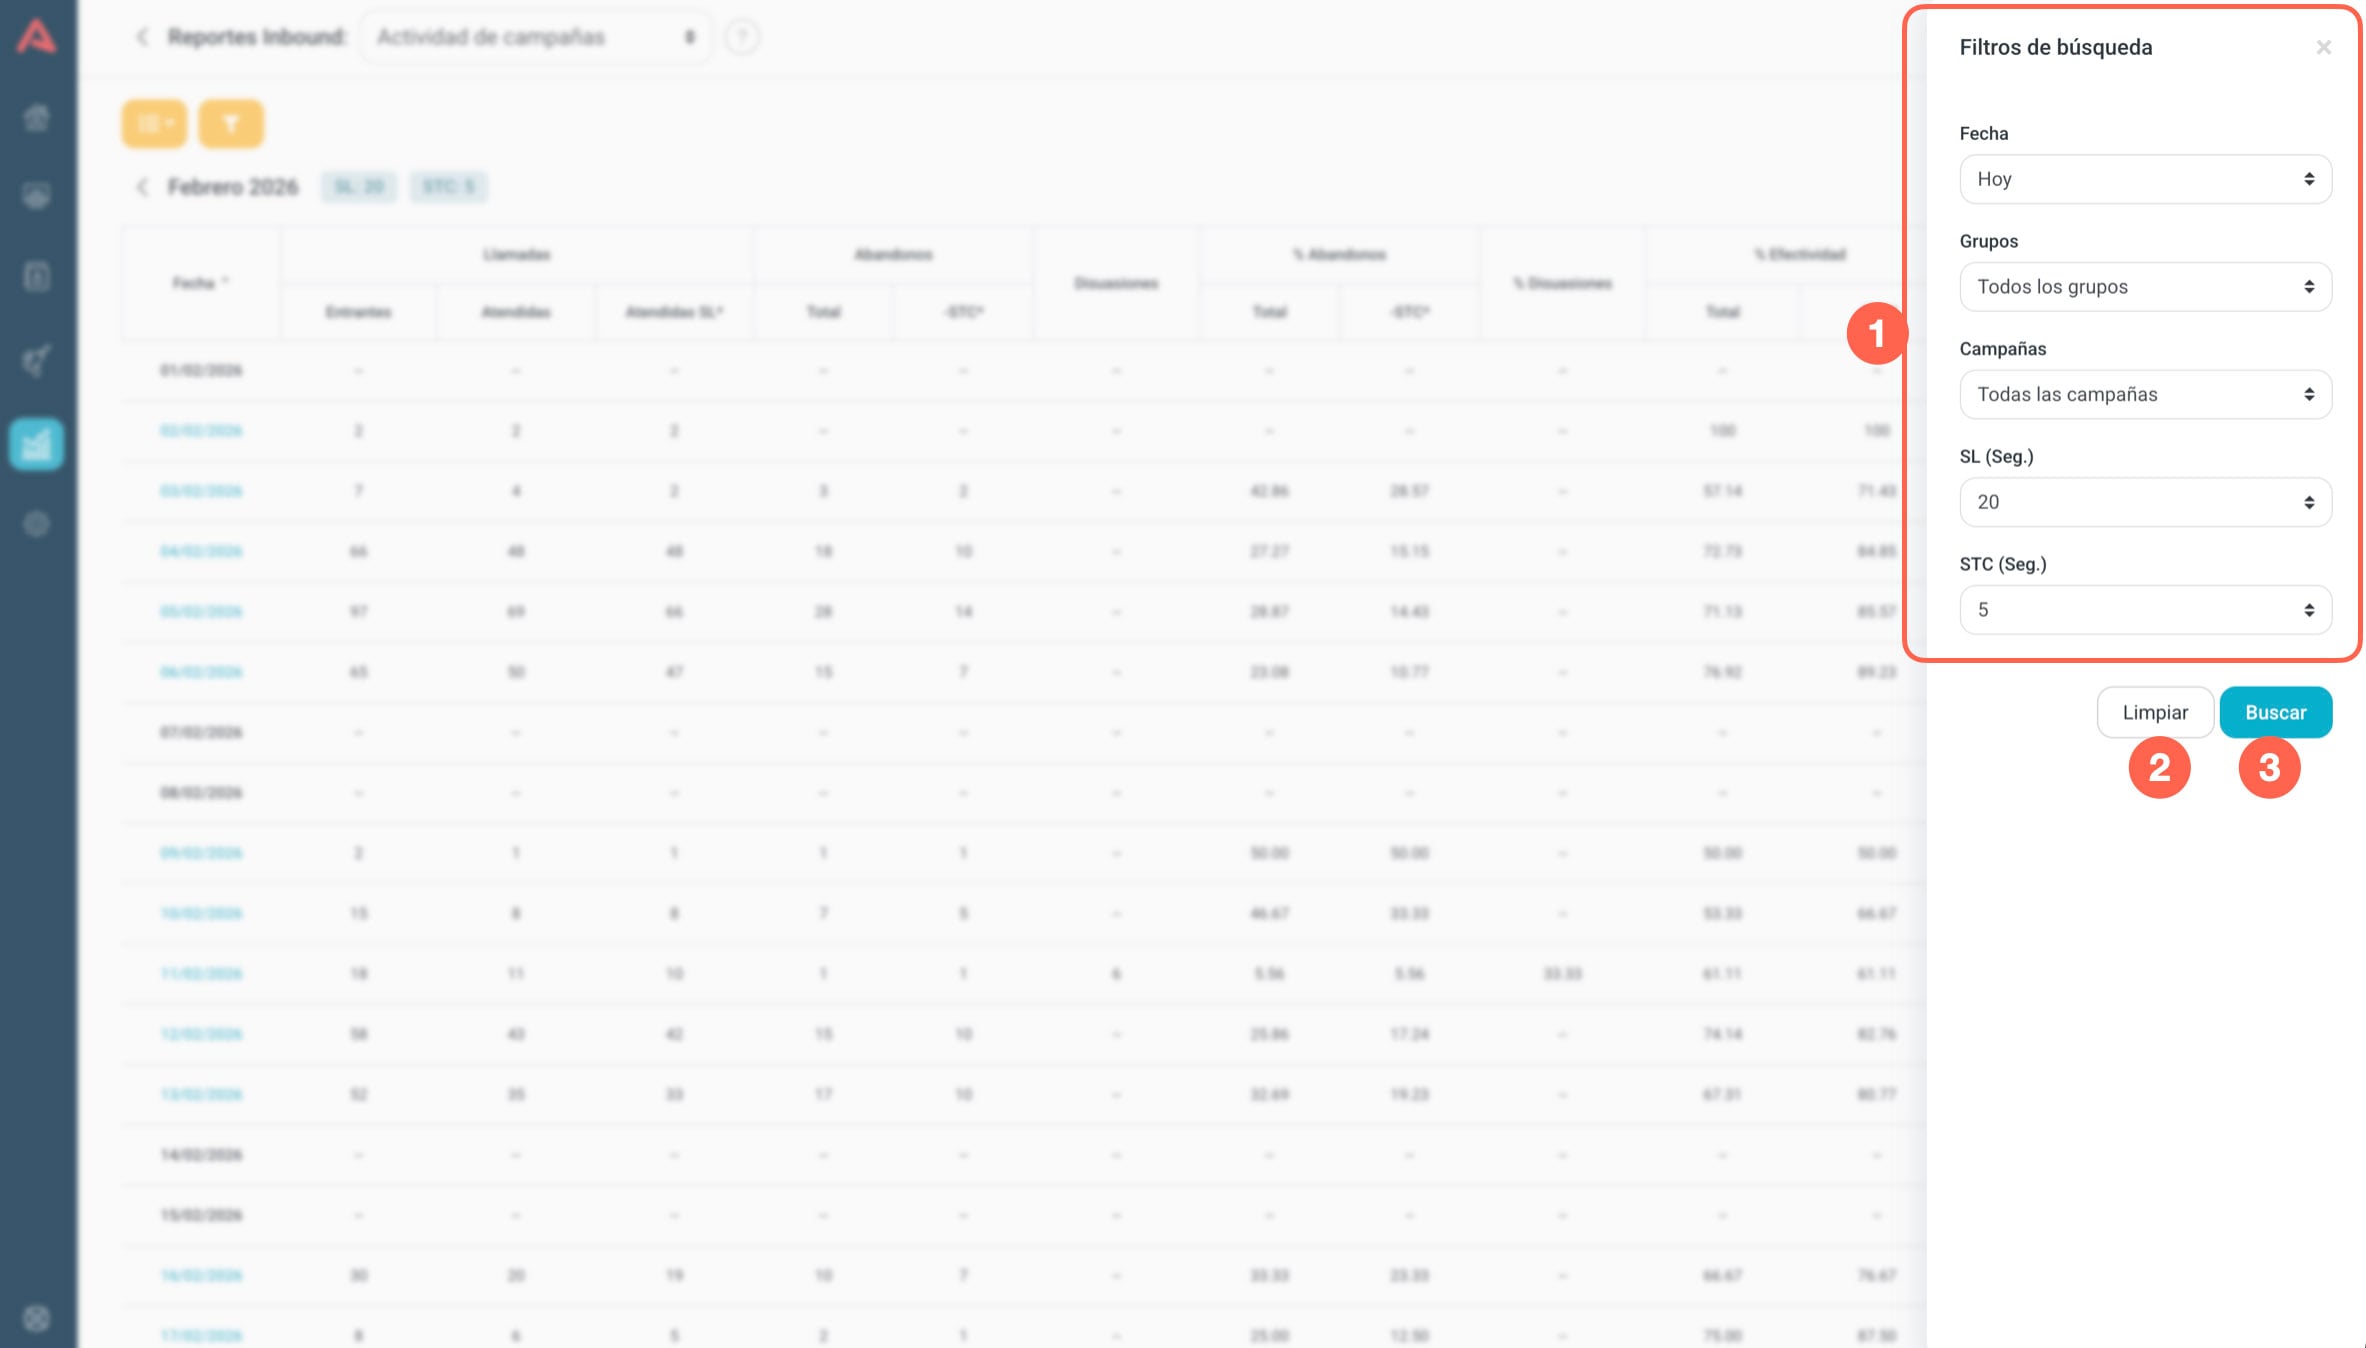
The date
Every report filters by date, and almost always with the same options:
- Today
- Yesterday
- Last 7 days
- Year
- Range, which lets you pick a start and an end date
Not every report carries all five. CDR, for one, has no Year, and instead caps the range: up to 31 days from the start date.
Almost every report opens on today's data and you widen the period from there. The two analytics reports in Quality control are the exception: they open empty and search nothing until you define a filter.
The rest of the criteria
What sits below the date depends on the report you are in. In the inbound voice ones you get the group, the campaign, the client and the SL and STC seconds; in the dialer ones, the dialer, the segment and the contact. Each article tells you which ones its own report carries.
At the bottom of the panel there are two buttons: Clear returns the criteria to their usual values, and Search applies the filters and refreshes the report.
Downloading as CSV
The blue button on the right downloads what you are looking at.
It opens and offers Download CSV, a text format that Excel, Google Sheets and any analysis tool will open. Some reports offer more than one download: call history, for instance, keeps the contacts separate from the call. And in Recordings and Speech Analytics this button fetches the audio as well as the table, and only works on the rows you have ticked.
What the file carries
The file honours the filters you have applied at that moment, not what happens to fit on screen. If the report runs to several pages, the download brings all of them.
And it usually carries more columns than the interface shows: the table hides a few so it fits, the file does not.
If the report holds many records the download takes a while, and the button stays disabled meanwhile. It has not frozen: it is building the file. Filtering before you download is the difference between waiting a few seconds and waiting a few minutes.